Performance regressions with AI coding agents: budgets, benchmarks and evidence for Claude Code and Codex
A coding agent adds one lookup per row, every test passes and the invoice page goes from 180 ms to 1.4 seconds. Tests prove behaviour, not speed. This playbook writes a performance budget into the brief, makes CI measure it, and asks the agent for before-and-after numbers instead of a confident summary.
Every test passed. The invoice page got eight times slower
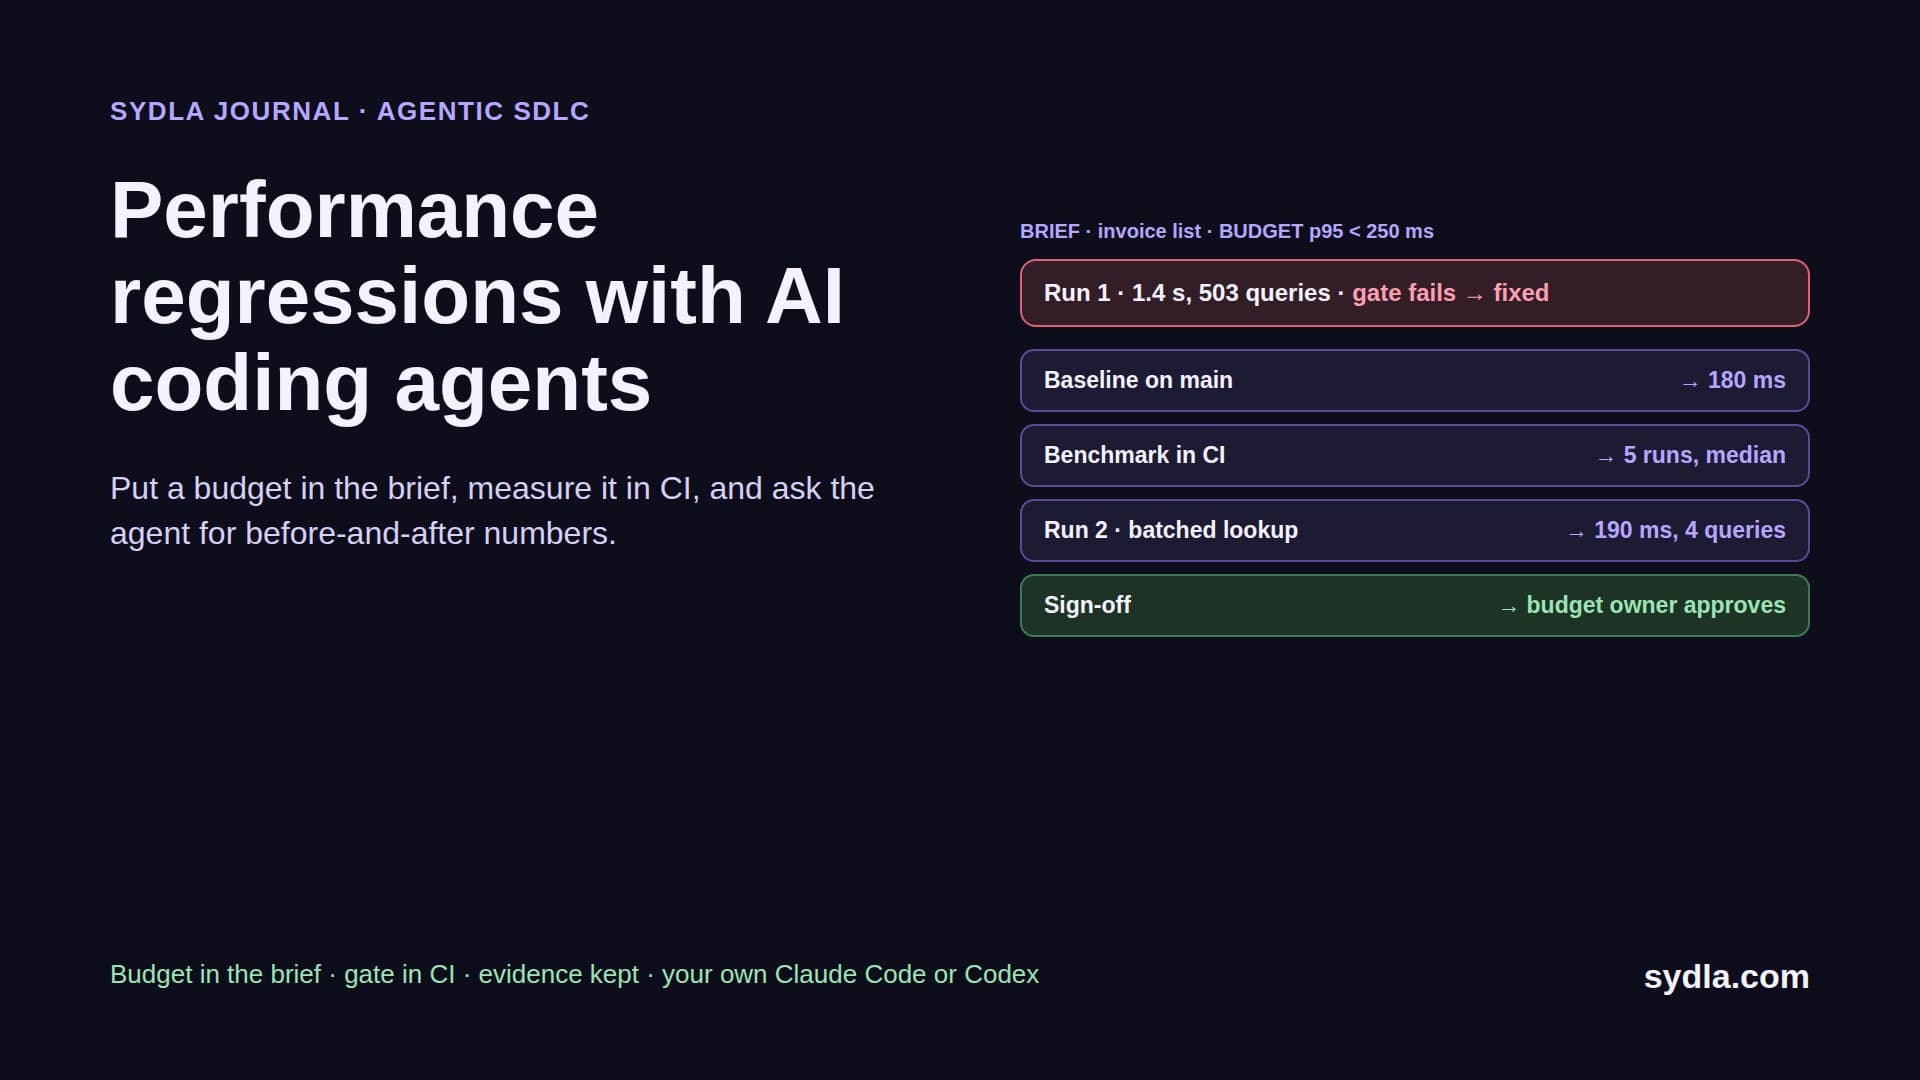
The ticket says: show the tax rate next to each invoice line. A coding agent finds the tax service, calls it for each row, updates the tests and opens a green merge request. The reviewer reads a tidy diff and approves. On Monday, the invoice list for a large customer takes 1.4 seconds instead of 180 milliseconds, because a page with 400 lines now makes 400 extra calls.
Nothing was wrong in the way the reviewer looked. Unit tests run on ten rows. The diff shows one new line inside a loop. Speed is a property of real data, real traffic and real machines, and none of those were in the ticket, the tests or the review. Agents make this worse in a quiet way: they write a lot of correct code quickly, and every extra query, re-render or bigger bundle gets merged with a passing build.
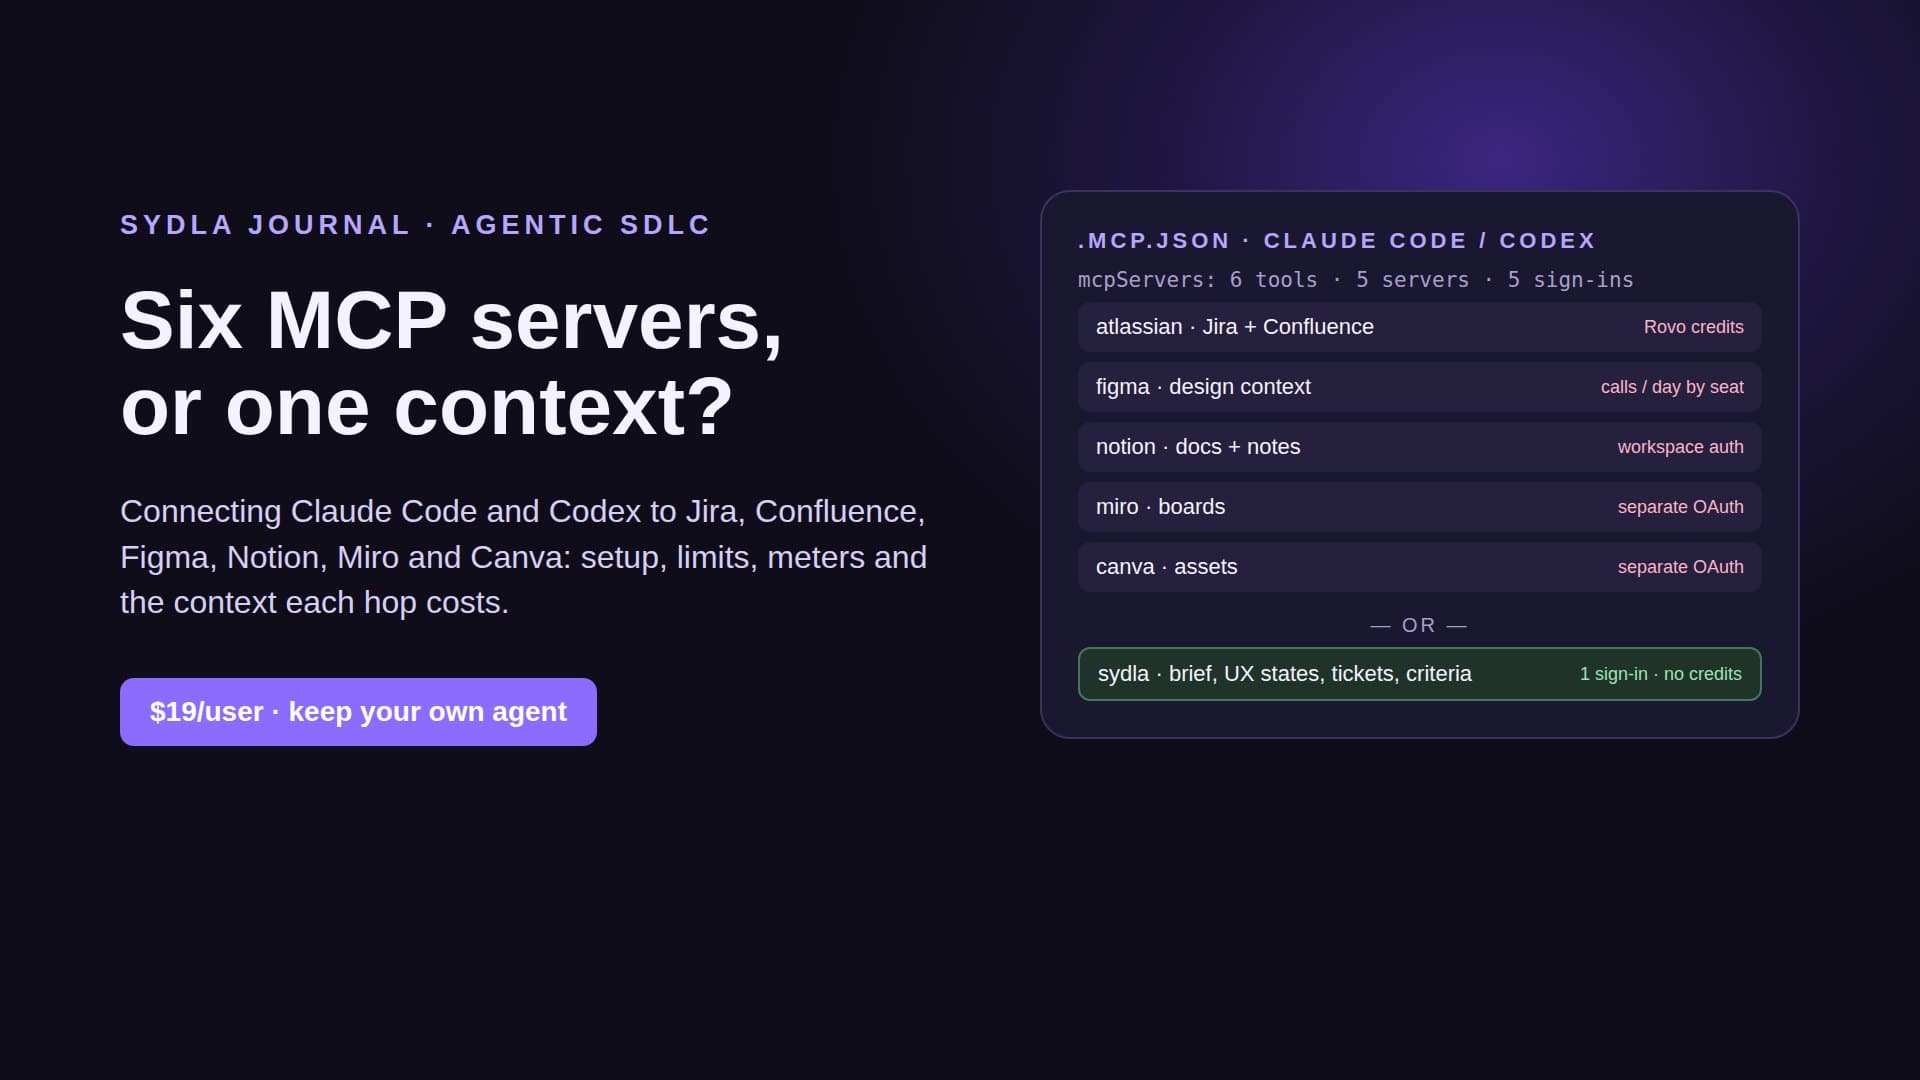
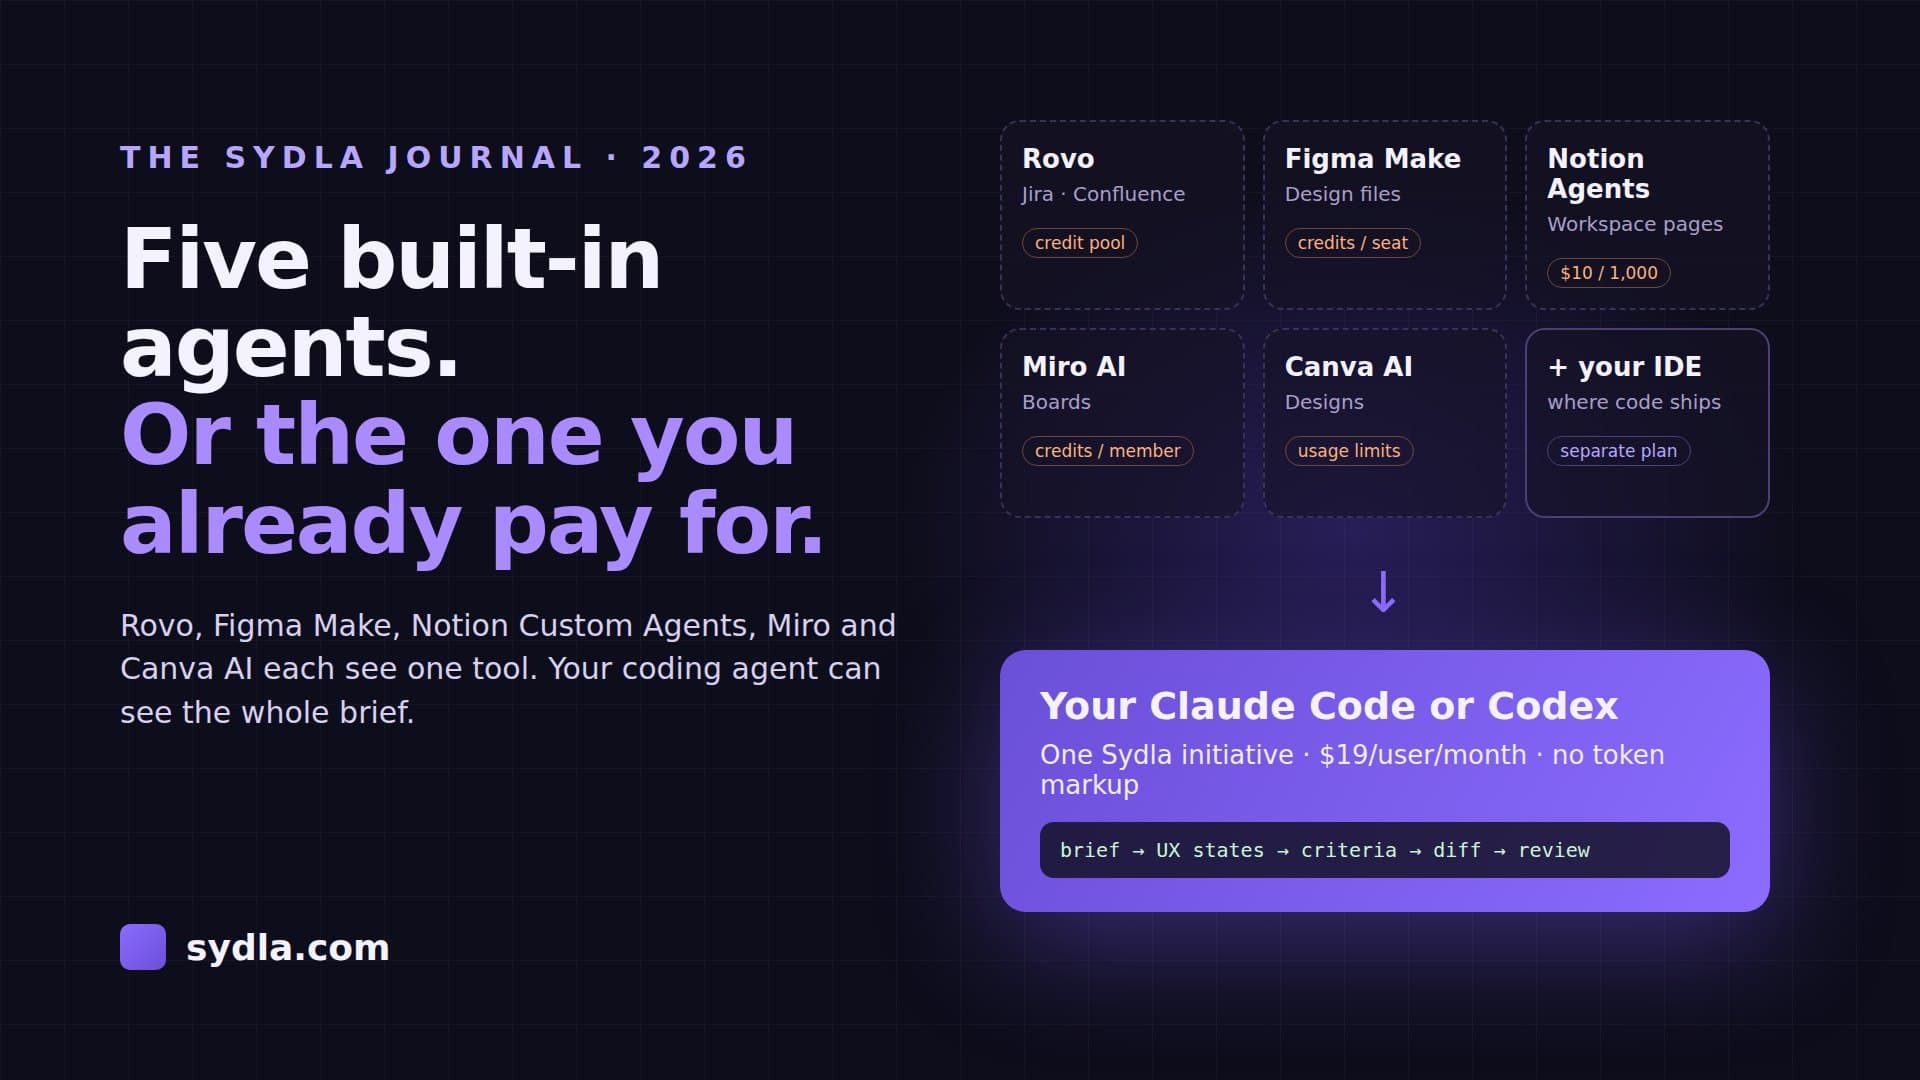
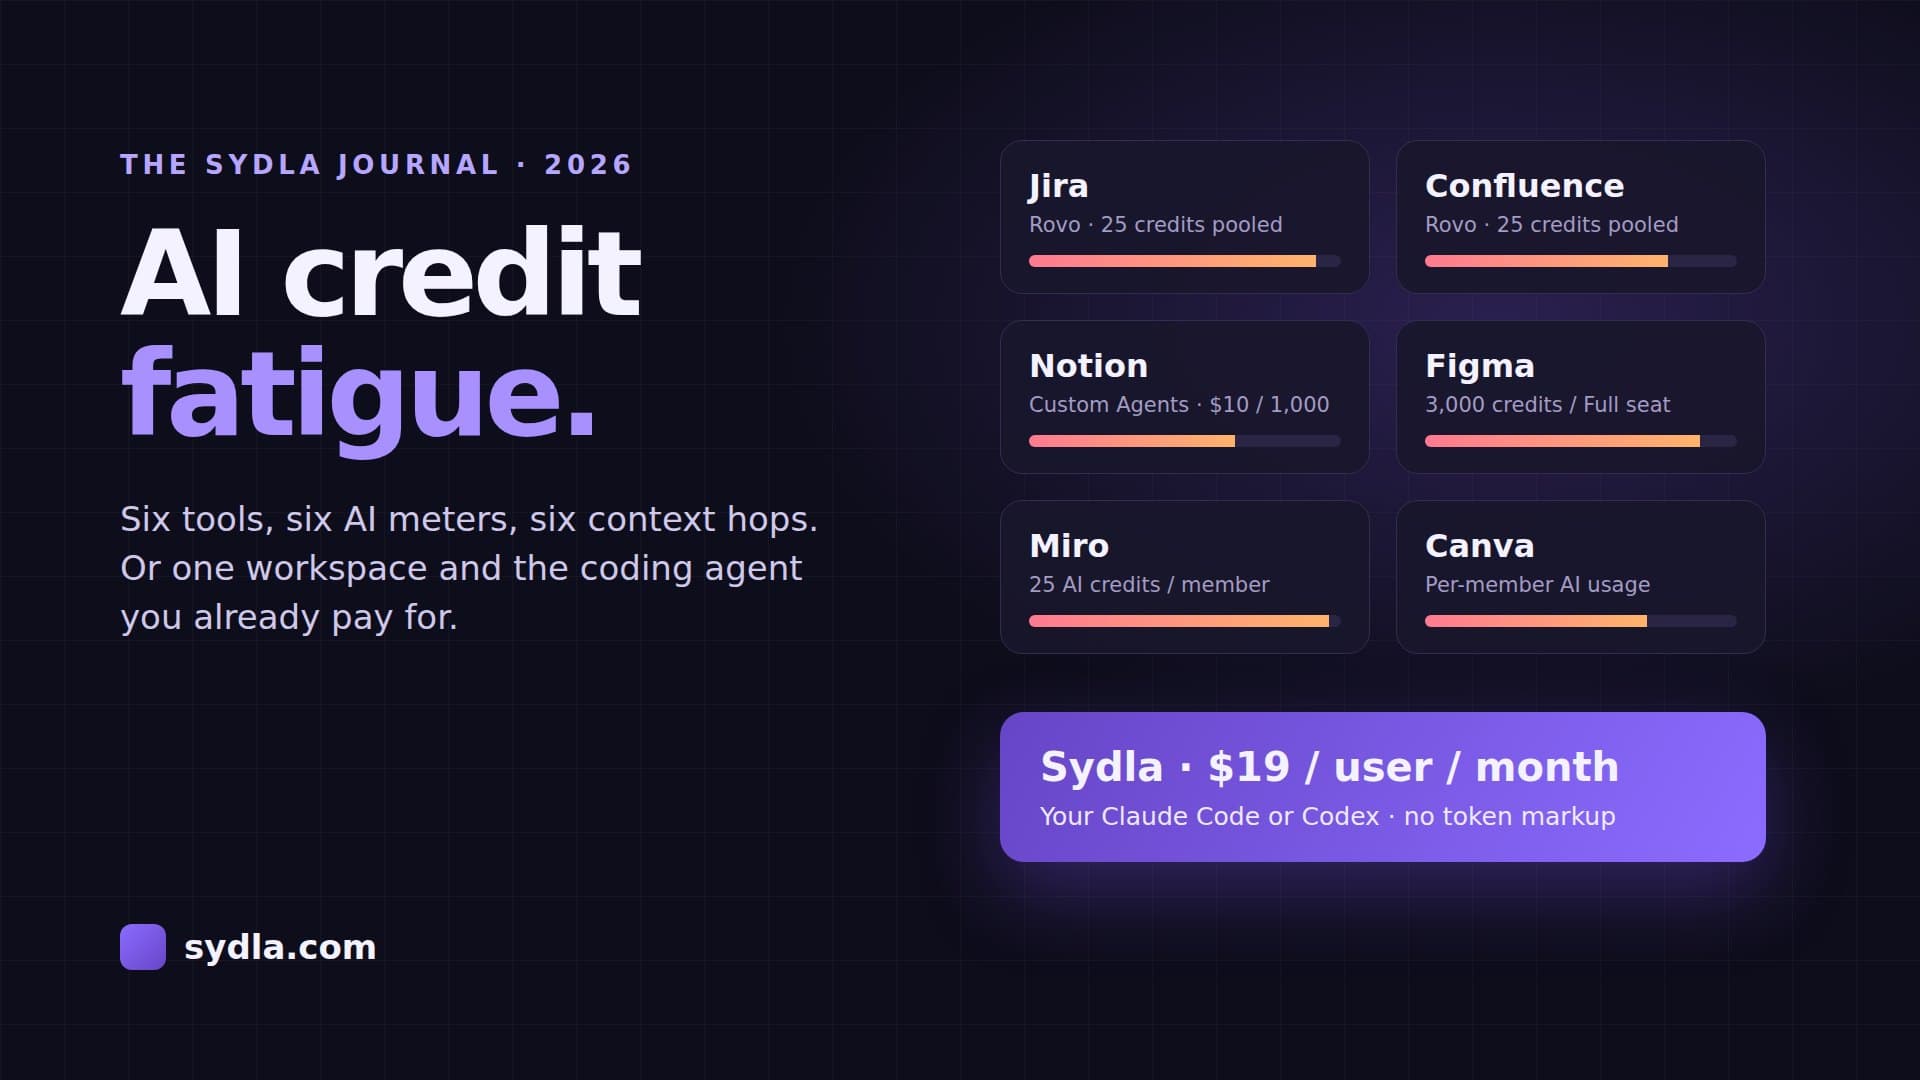
The context that would have caught it is scattered. The ticket lives in Jira, the performance targets in a Confluence page, the customer's data size in Notion, the loading states in Figma, the service map on a Miro board and the status update in Canva. Six tools, six context hops for an agent, up to six AI credit meters. Our AI credit fatigue piece adds up what that costs.
This playbook does three things: it puts a number in the brief, it makes CI measure that number on every change, and it asks the agent for before-and-after evidence instead of a sentence that says the code is fast.
What the performance toolchain gives your agent in 2026
Measuring speed in a pipeline is no longer exotic, and several tools now talk to agents directly. The pieces worth knowing:
- Core Web Vitals as the user-facing target. Google's thresholds for a good page are LCP within 2.5 seconds, INP of 200 milliseconds or less and CLS of 0.1 or less, measured at the 75th percentile of real page loads. INP replaced First Input Delay in March 2024, and lab tools can't fully measure it.
- Lighthouse CI for web pages in a pull request. It runs Lighthouse against preview builds and fails the job when an assertion breaks. It runs three times by default to soften noise, and you choose how results are combined: median, optimistic, pessimistic or median-run.
- Benchmarks with an MCP server. CodSpeed shipped an MCP server and agent skills on 16 March 2026: an agent can query flamegraphs, compare two runs and run a measure, change, re-measure loop with the codspeed-optimize skill. Since July 2026 its compare report shows environment changes, so an agent can tell a slower runner from slower code.
- Bots that open fix requests. CodSpeed's Wizard answers to @codspeedbot in a pull request, is on by default for every organization and can open a pull request with a proposed fix. Decide whether you want that before it decides for you.
- The agents themselves. OpenAI lists performance optimization among the ways its own teams use Codex, such as finding repeated expensive database calls and drafting batched queries. Anthropic's Claude Code best practices make the same point for every task: give the agent a way to verify its own work.
Field data is the final judge, and it is slow. The Chrome UX Report uses a rolling 28-day window, so a regression merged today shows up in search data over the following weeks. That is why the budget has to be checked before the merge, not discovered after it.
Step 1: sort every change by its performance risk
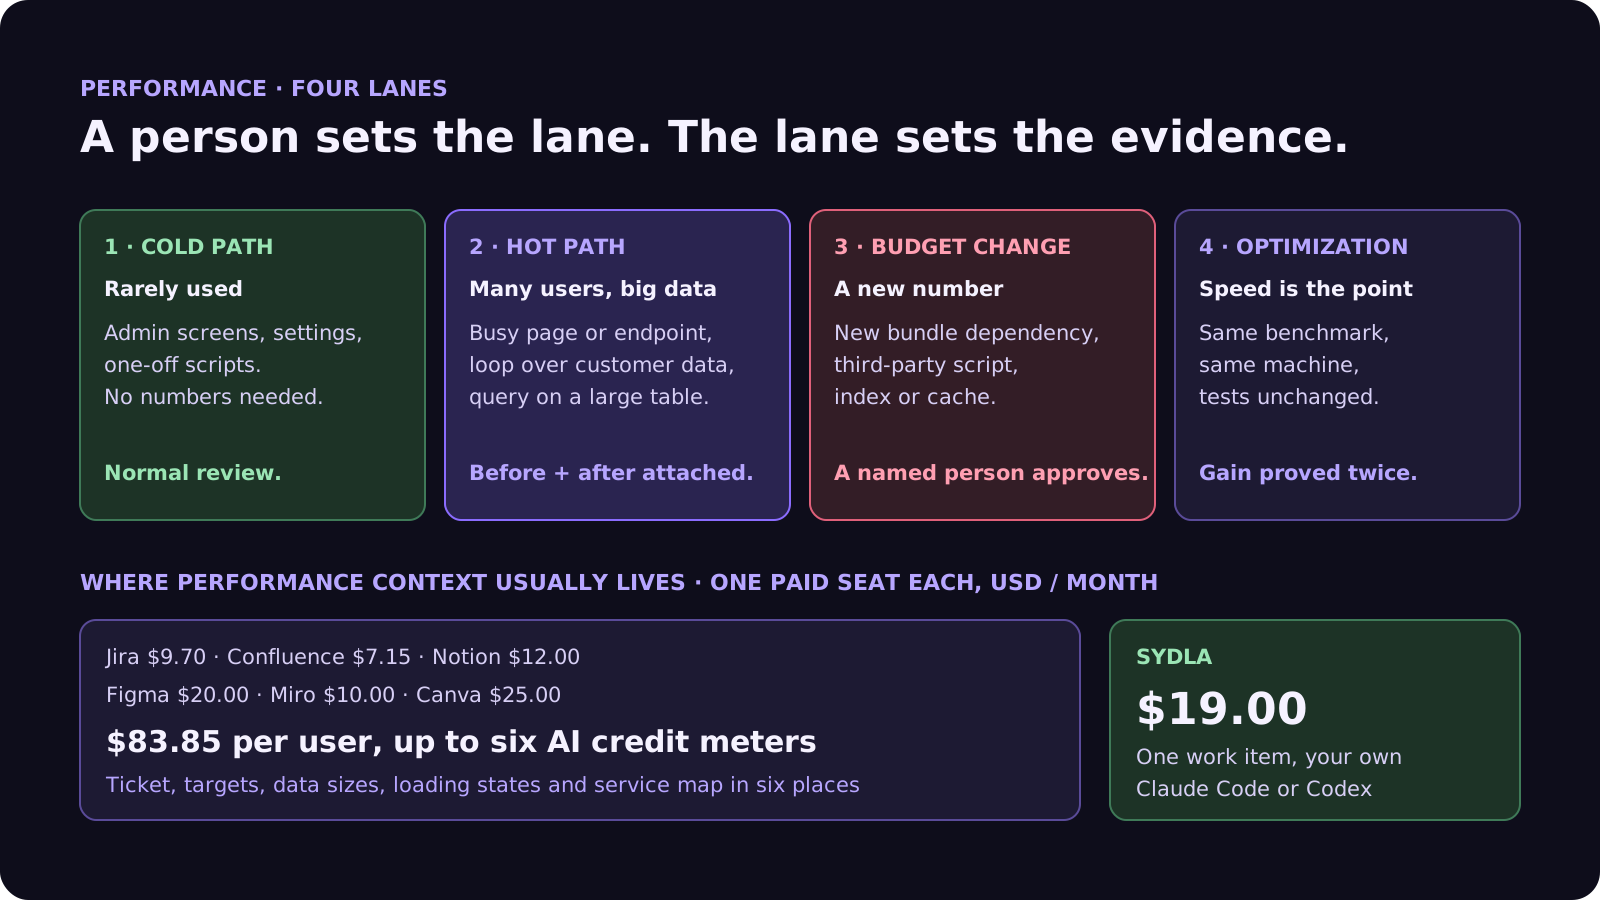
Not every ticket needs a benchmark. A person picks one of four lanes when the ticket is written, and the lane decides what evidence the agent owes:
- Cold path. Admin screens, one-off scripts, settings. Normal review. No numbers needed.
- Hot path. A page or endpoint many users hit, a loop over customer data, a query on a large table. The agent must run the relevant benchmark or Lighthouse check before and after, and attach both.
- Budget change. Anything that adds a dependency to the client bundle, a new third-party script, a new index or a cache. The budget file itself may change, but only with a person's name next to the new number.
- Optimization. A ticket whose whole point is speed. The agent proves the gain with the same benchmark on the same machine, and proves behaviour is unchanged with the existing tests.
Agents misjudge lanes in a predictable way: a loop that calls a service looks like a small feature, not a hot path. Make the lane a field on the ticket, let the agent suggest raising it, and only let a person lower it.
Step 2: the seven-field performance brief
For hot paths, budget changes and optimizations, add these seven fields next to the acceptance criteria:
- 1. What is measured. The endpoint, page, job or function, and the metric: p95 latency, LCP, INP, bundle size, memory or queries per request.
- 2. The budget. A number with a unit and a percentile. Invoice list p95 under 250 ms with 500 lines, not just fast.
- 3. Realistic data. The size of the biggest real customer, or a seeded fixture that matches it. Ten rows prove nothing about a loop.
- 4. How to measure. The exact command or CI job, how many runs and which machine. If the agent can't run it, it can't prove anything.
- 5. Baseline. The number on main before the change, measured the same way. Without it, after has no meaning.
- 6. Out of bounds. What the agent must not do to hit the number: no caching of data that must be fresh, no skipped validation, no editing the budget file or the benchmark itself.
- 7. Done means. Before-and-after numbers attached, budget met, existing tests green, and a person has read the numbers.
Field 6 matters more with agents than with people. A model asked to make a number go down will find the shortest path, and sometimes that path is a cache with no expiry or a loosened benchmark. Write the forbidden shortcuts down. Our acceptance criteria guide explains why agents need criteria they can check.
Where performance context lives today, and what it costs
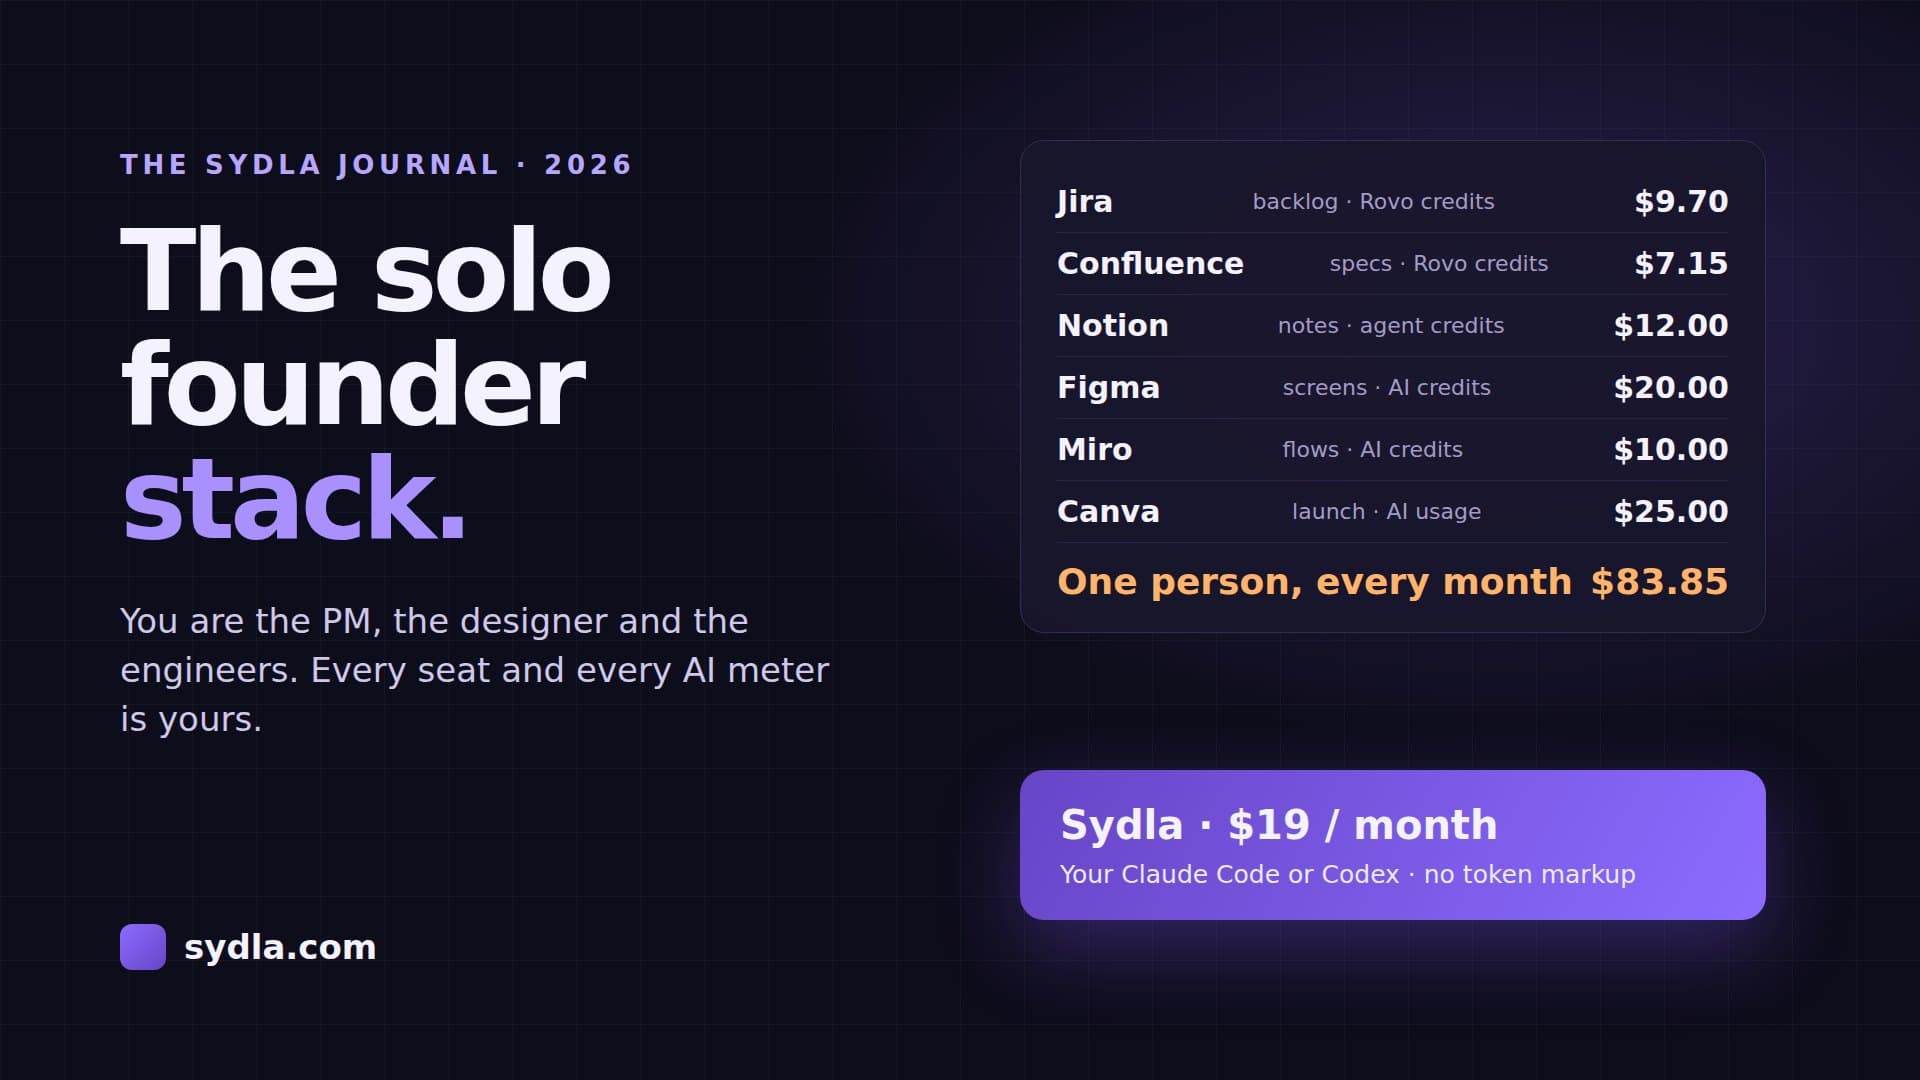
A performance brief pulls from every tool the team uses. Here is what one paid seat of each costs, and how each one bills for its built-in AI:
| Tool and plan | Seat / month | Built-in AI billing | Performance context it holds |
|---|---|---|---|
| Jira Standard | $9.70 | Rovo credits: 25 per user per month on Standard, 70 on Premium, 150 on Enterprise; $0.01 per extra credit from 3 December 2026 | The ticket, often without a budget |
| Confluence Standard | $7.15 | Rovo, same credit pool | Performance targets and runbooks |
| Notion Plus | $12.00 | Notion AI and Custom Agents on Notion credits | Customer notes and data sizes |
| Figma Professional, Full seat | $20.00 | AI credits per seat, MCP reads capped per day | Loading and skeleton states |
| Miro Starter | $10.00 | Create with AI on Miro credits | The service map |
| Canva Business | $25.00 | Canva AI usage per member | The status update after an incident |
| Six-tool total | $83.85 | Up to six meters, plus your coding agent | Six places to look |
| [Sydla](/) | $19.00 | None: your own Claude Code or Codex plan pays for the model, with no markup | One work item: brief, budget, states, runs and evidence |
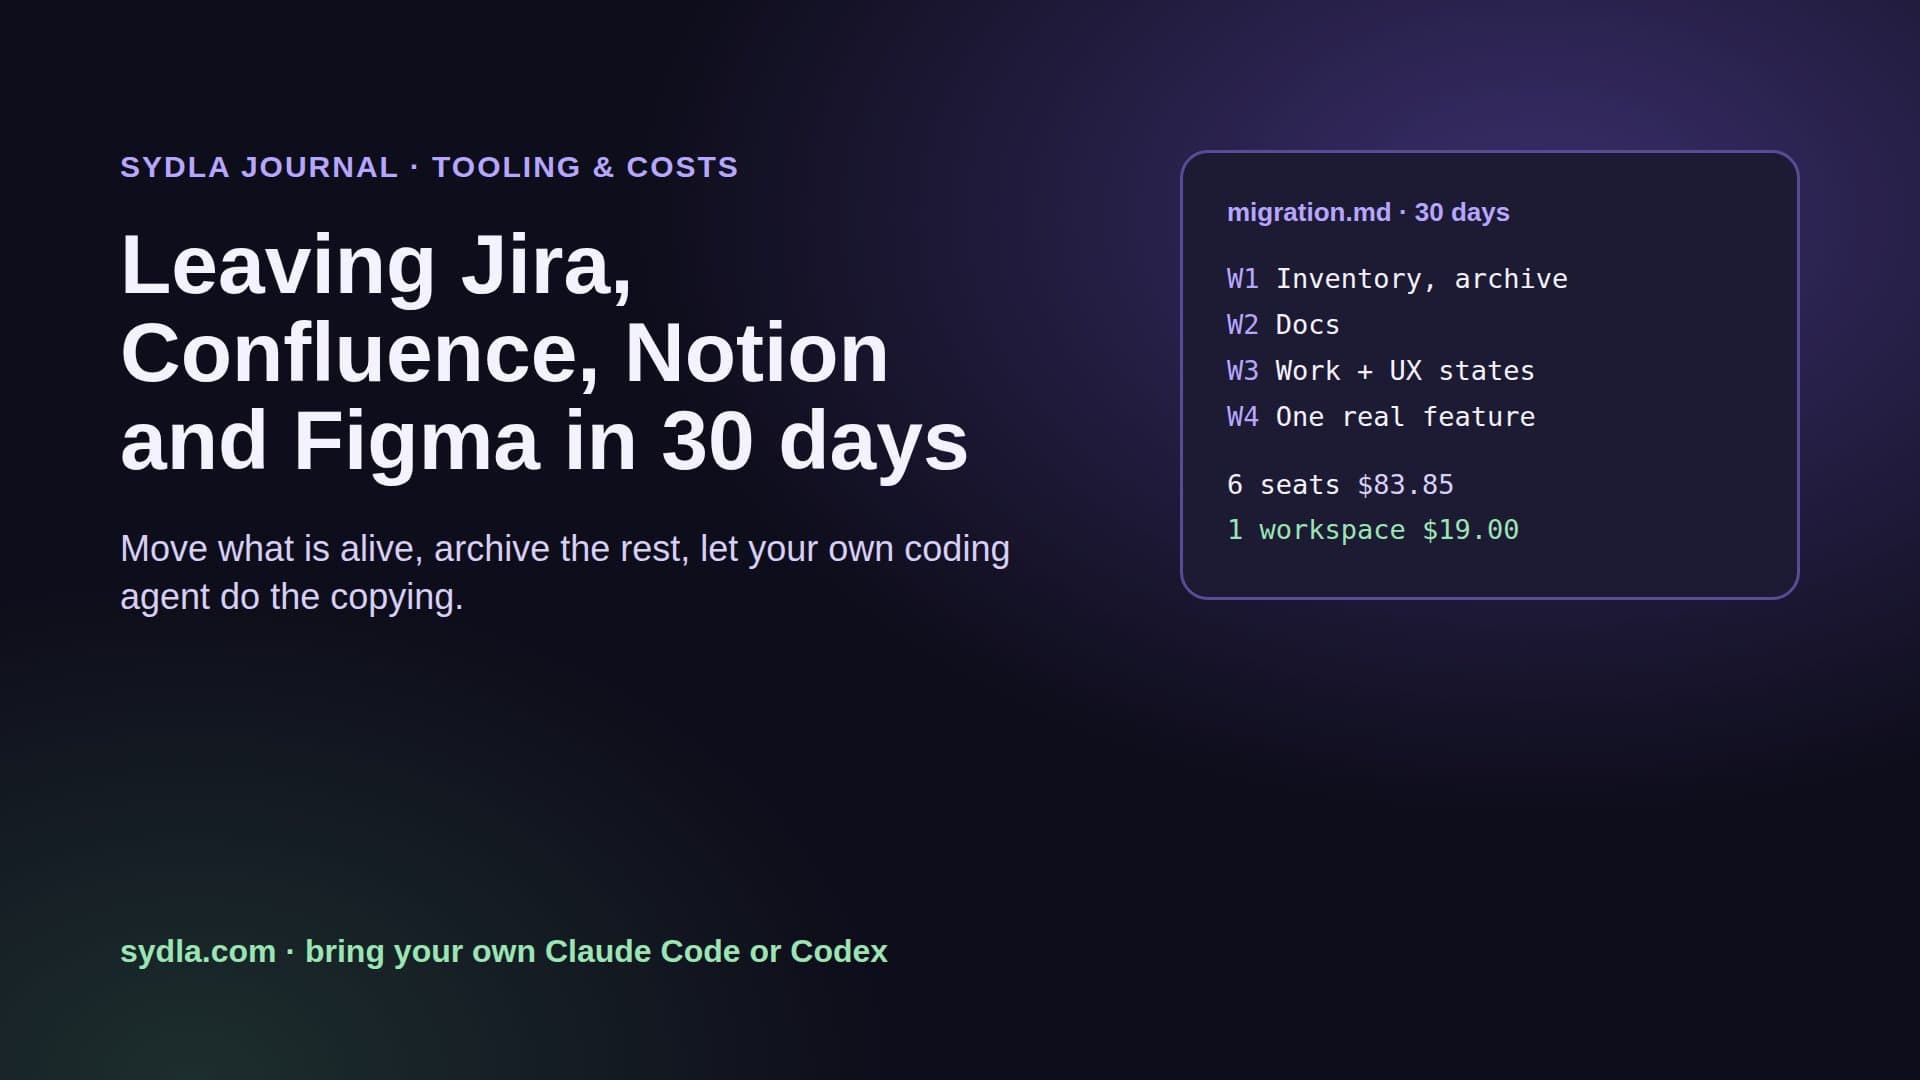
That is a saving of $64.85 per user per month, and one MCP server for the agent to read instead of six. See the full comparison and Sydla pricing for the details.
Step 3: make CI measure the budget, not the agent
An agent's claim that a change is faster is a hypothesis. CI turns it into a fact. Three gates cover most teams:
- Web pages: Lighthouse CI. Assert on the metrics in the brief, run at least three times, and use the median. Keep the assertion file owned by people, through code owners, so the agent can propose a new number but can't merge one.
- Code paths: benchmarks. A benchmark for each hot path, run on the same runner class on every merge request, compared with main. CodSpeed, or your language's benchmark tool with a stored baseline, both work. Flag regressions over a set threshold, such as 10%.
- Data access: query counts. A test that counts queries per request on a realistic fixture catches the classic agent regression, the N+1 query, without any timing noise.
Then watch the field. Real-user monitoring on the hot paths, with an alert tied to the same budget, catches what a lab can't, such as INP on slow phones. When an alert fires, it becomes a ticket with the numbers attached. Our failing CI guide covers telling a real failure from a noisy one.
Step 4: review the numbers, not the summary
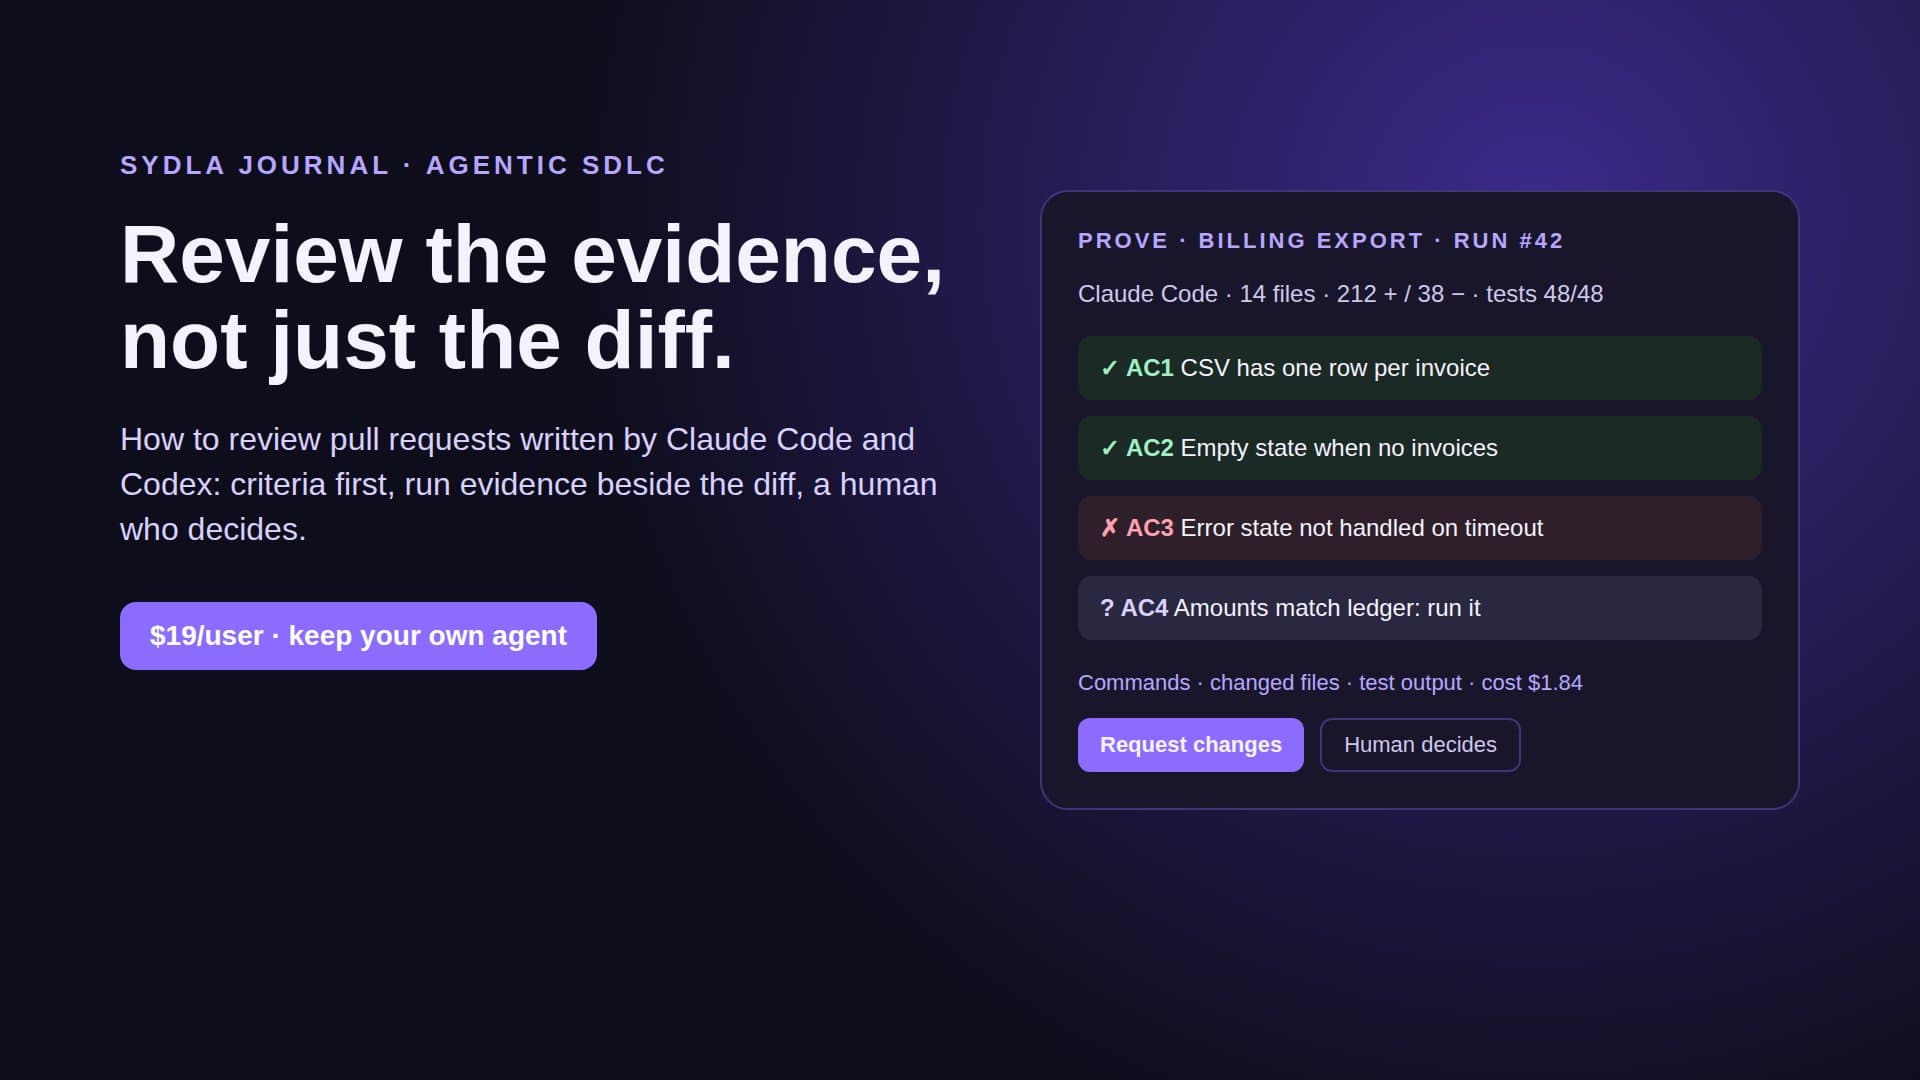
A reviewer can't eyeball speed in a diff, but they can check evidence. On every hot-path merge request, look for four things:
- Same method twice. Before and after were measured with the same command, the same data and the same machine. Two different laptops are not a comparison.
- The budget file is untouched, or its change is approved by a person who owns the number.
- No forbidden shortcuts. New caches have an expiry and an invalidation, no validation was removed, the benchmark still measures the real path.
- A fresh pair of eyes. A second agent session, read-only and without the first session's reasoning, reads the diff for loops over data, new network calls and new client dependencies.
This is the same evidence-first review we describe in how to review AI-generated pull requests, applied to one property the tests don't cover.
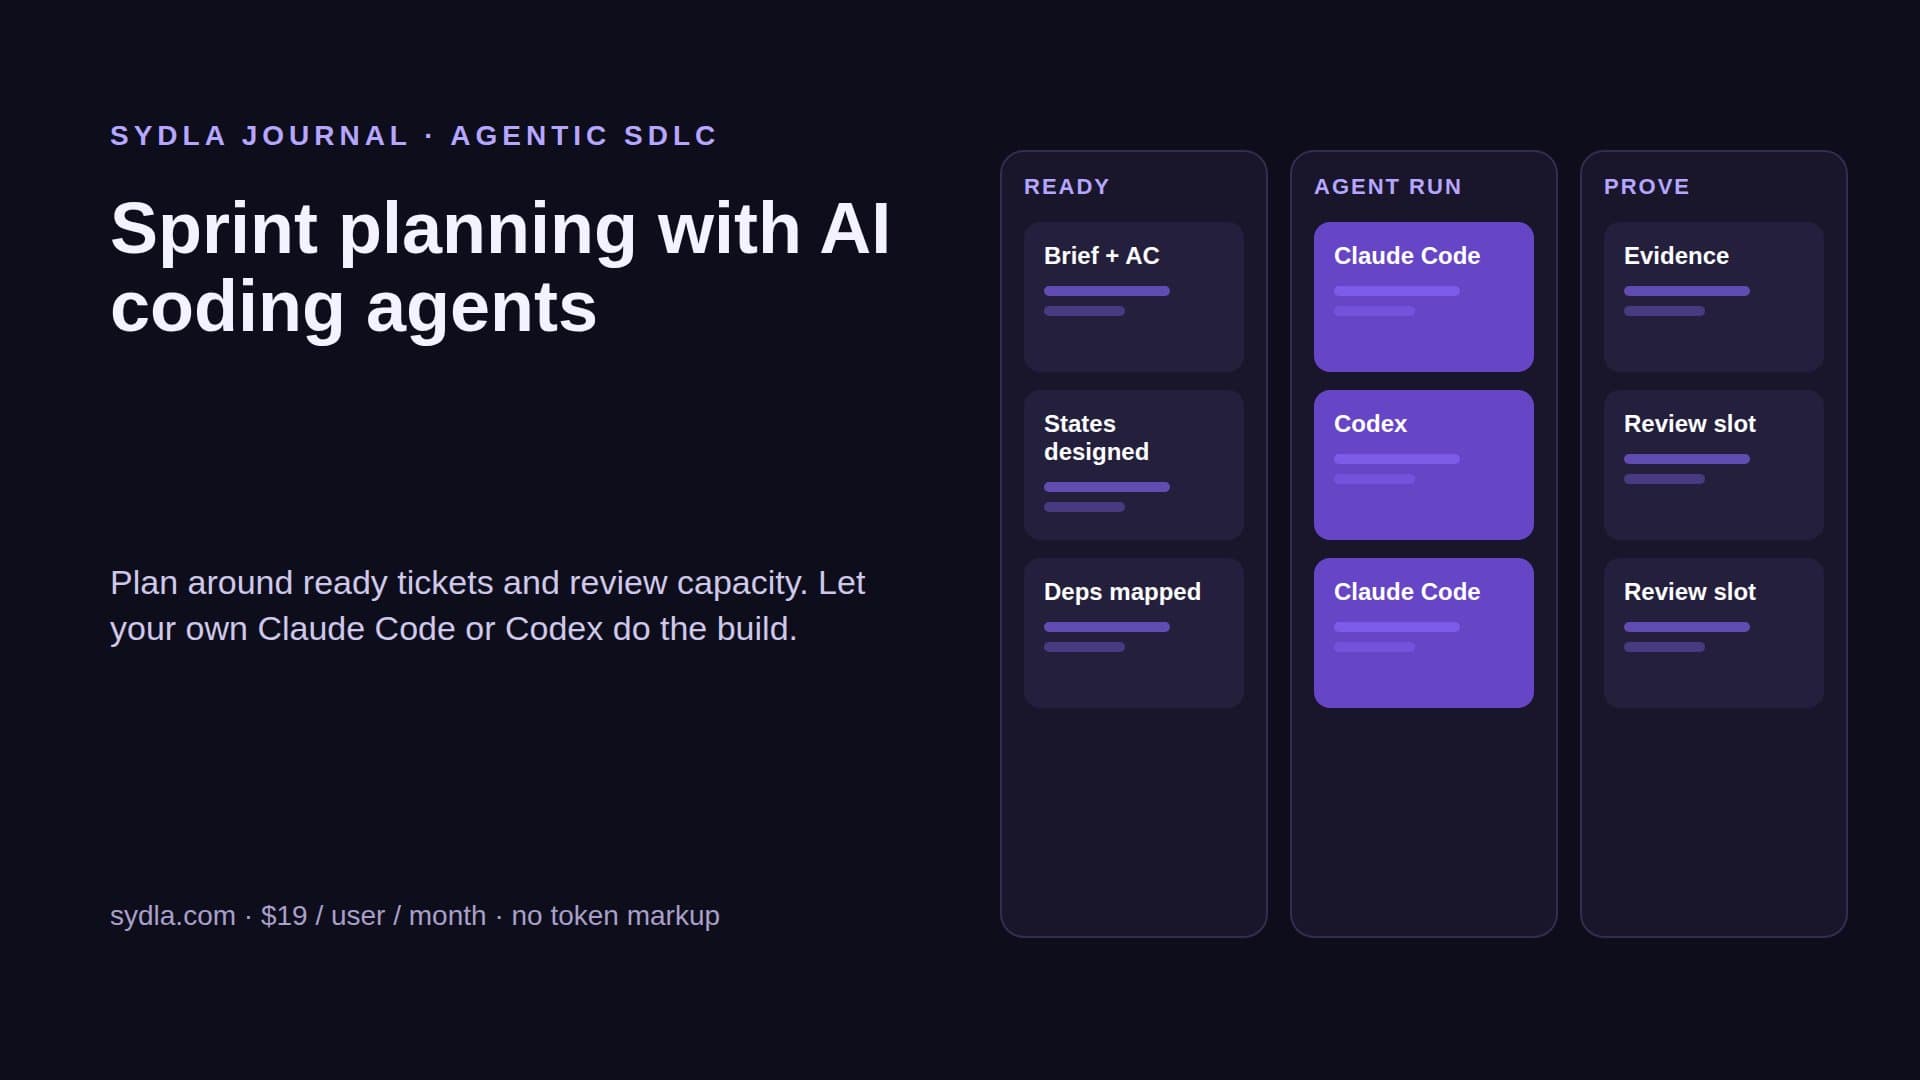
Walkthrough: brief, UX Studio, your agent in Sydla Desktop, review
Here is how a hot-path change moves through Sydla on one work item, with the coding agent you already pay for.
- Brief on the work item. The ticket carries the lane, the acceptance criteria and the seven performance fields, written once and read by every agent and person.
- States in UX Studio. Performance has screens too: the skeleton while data loads, the invoice list with 500 lines, the empty state. Designing them makes slow paths visible before code exists. Our design handoff guide explains why states beat screenshots.
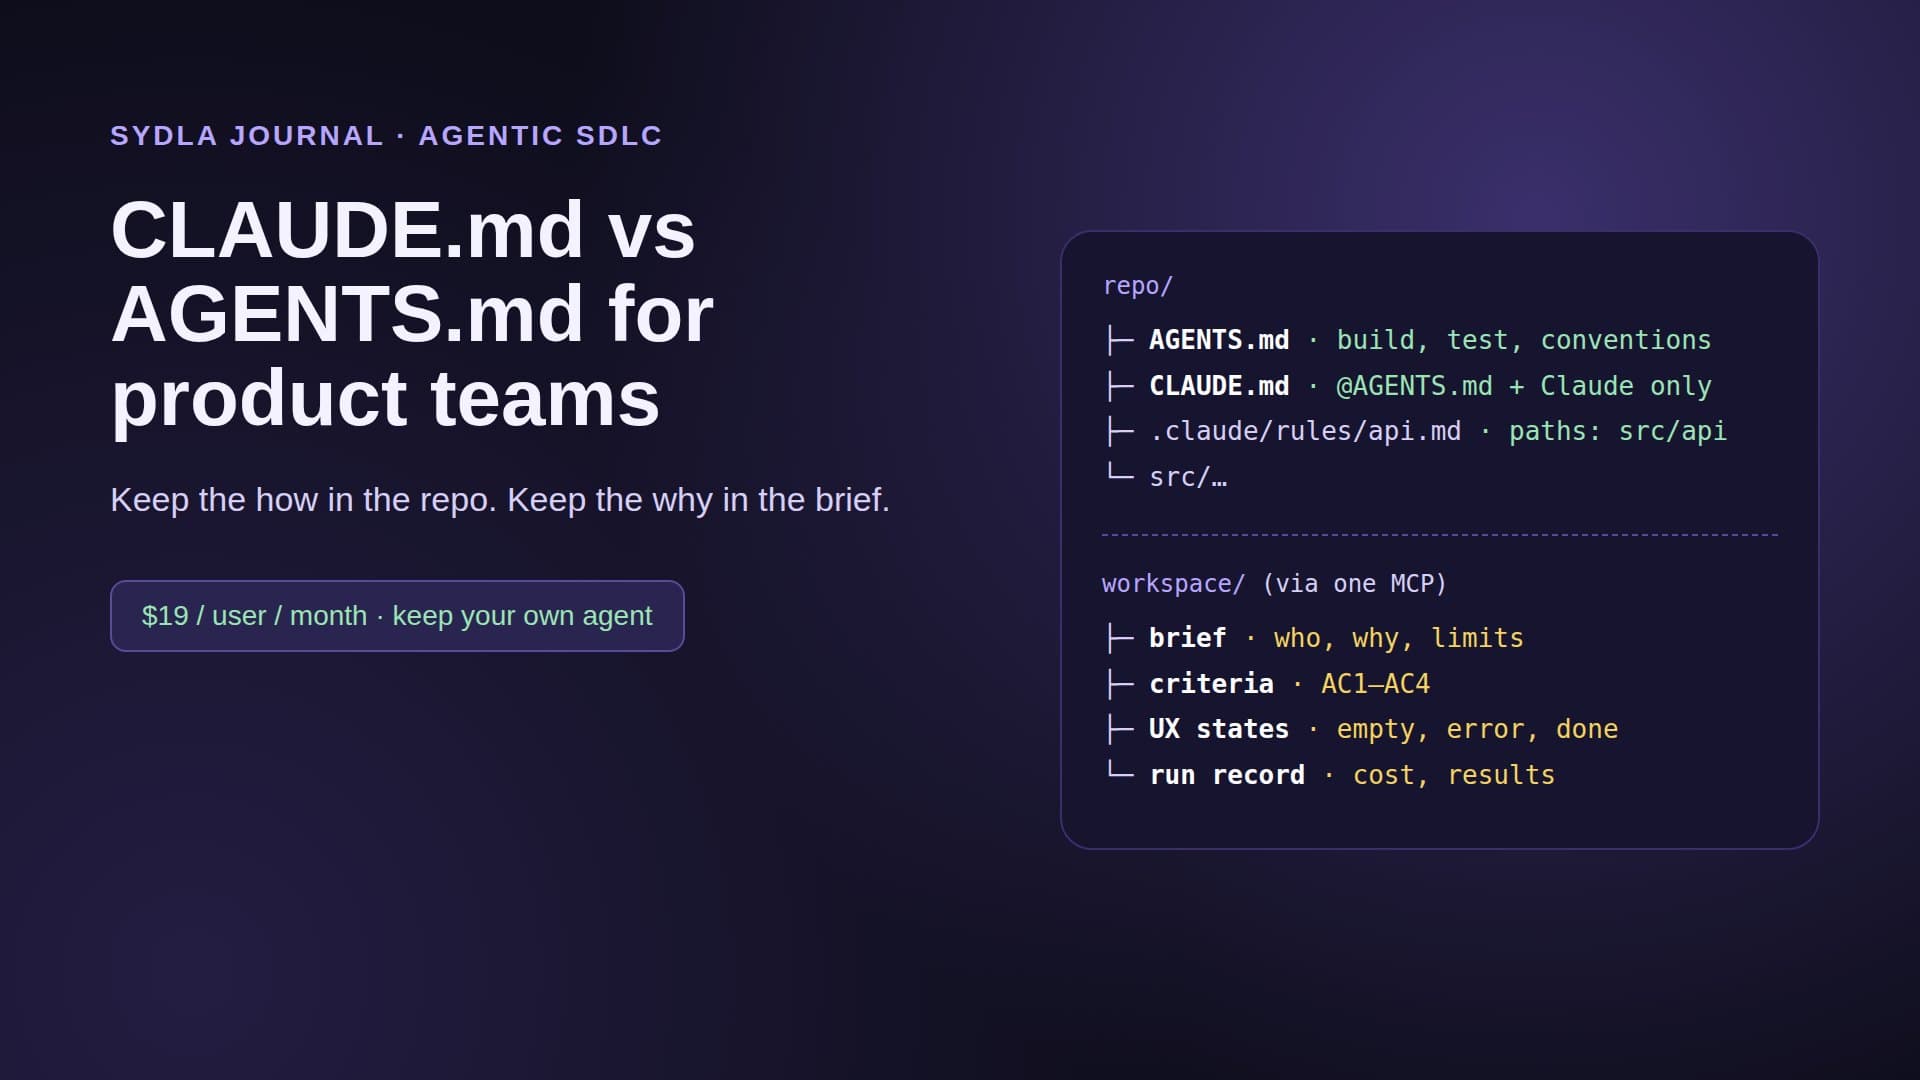
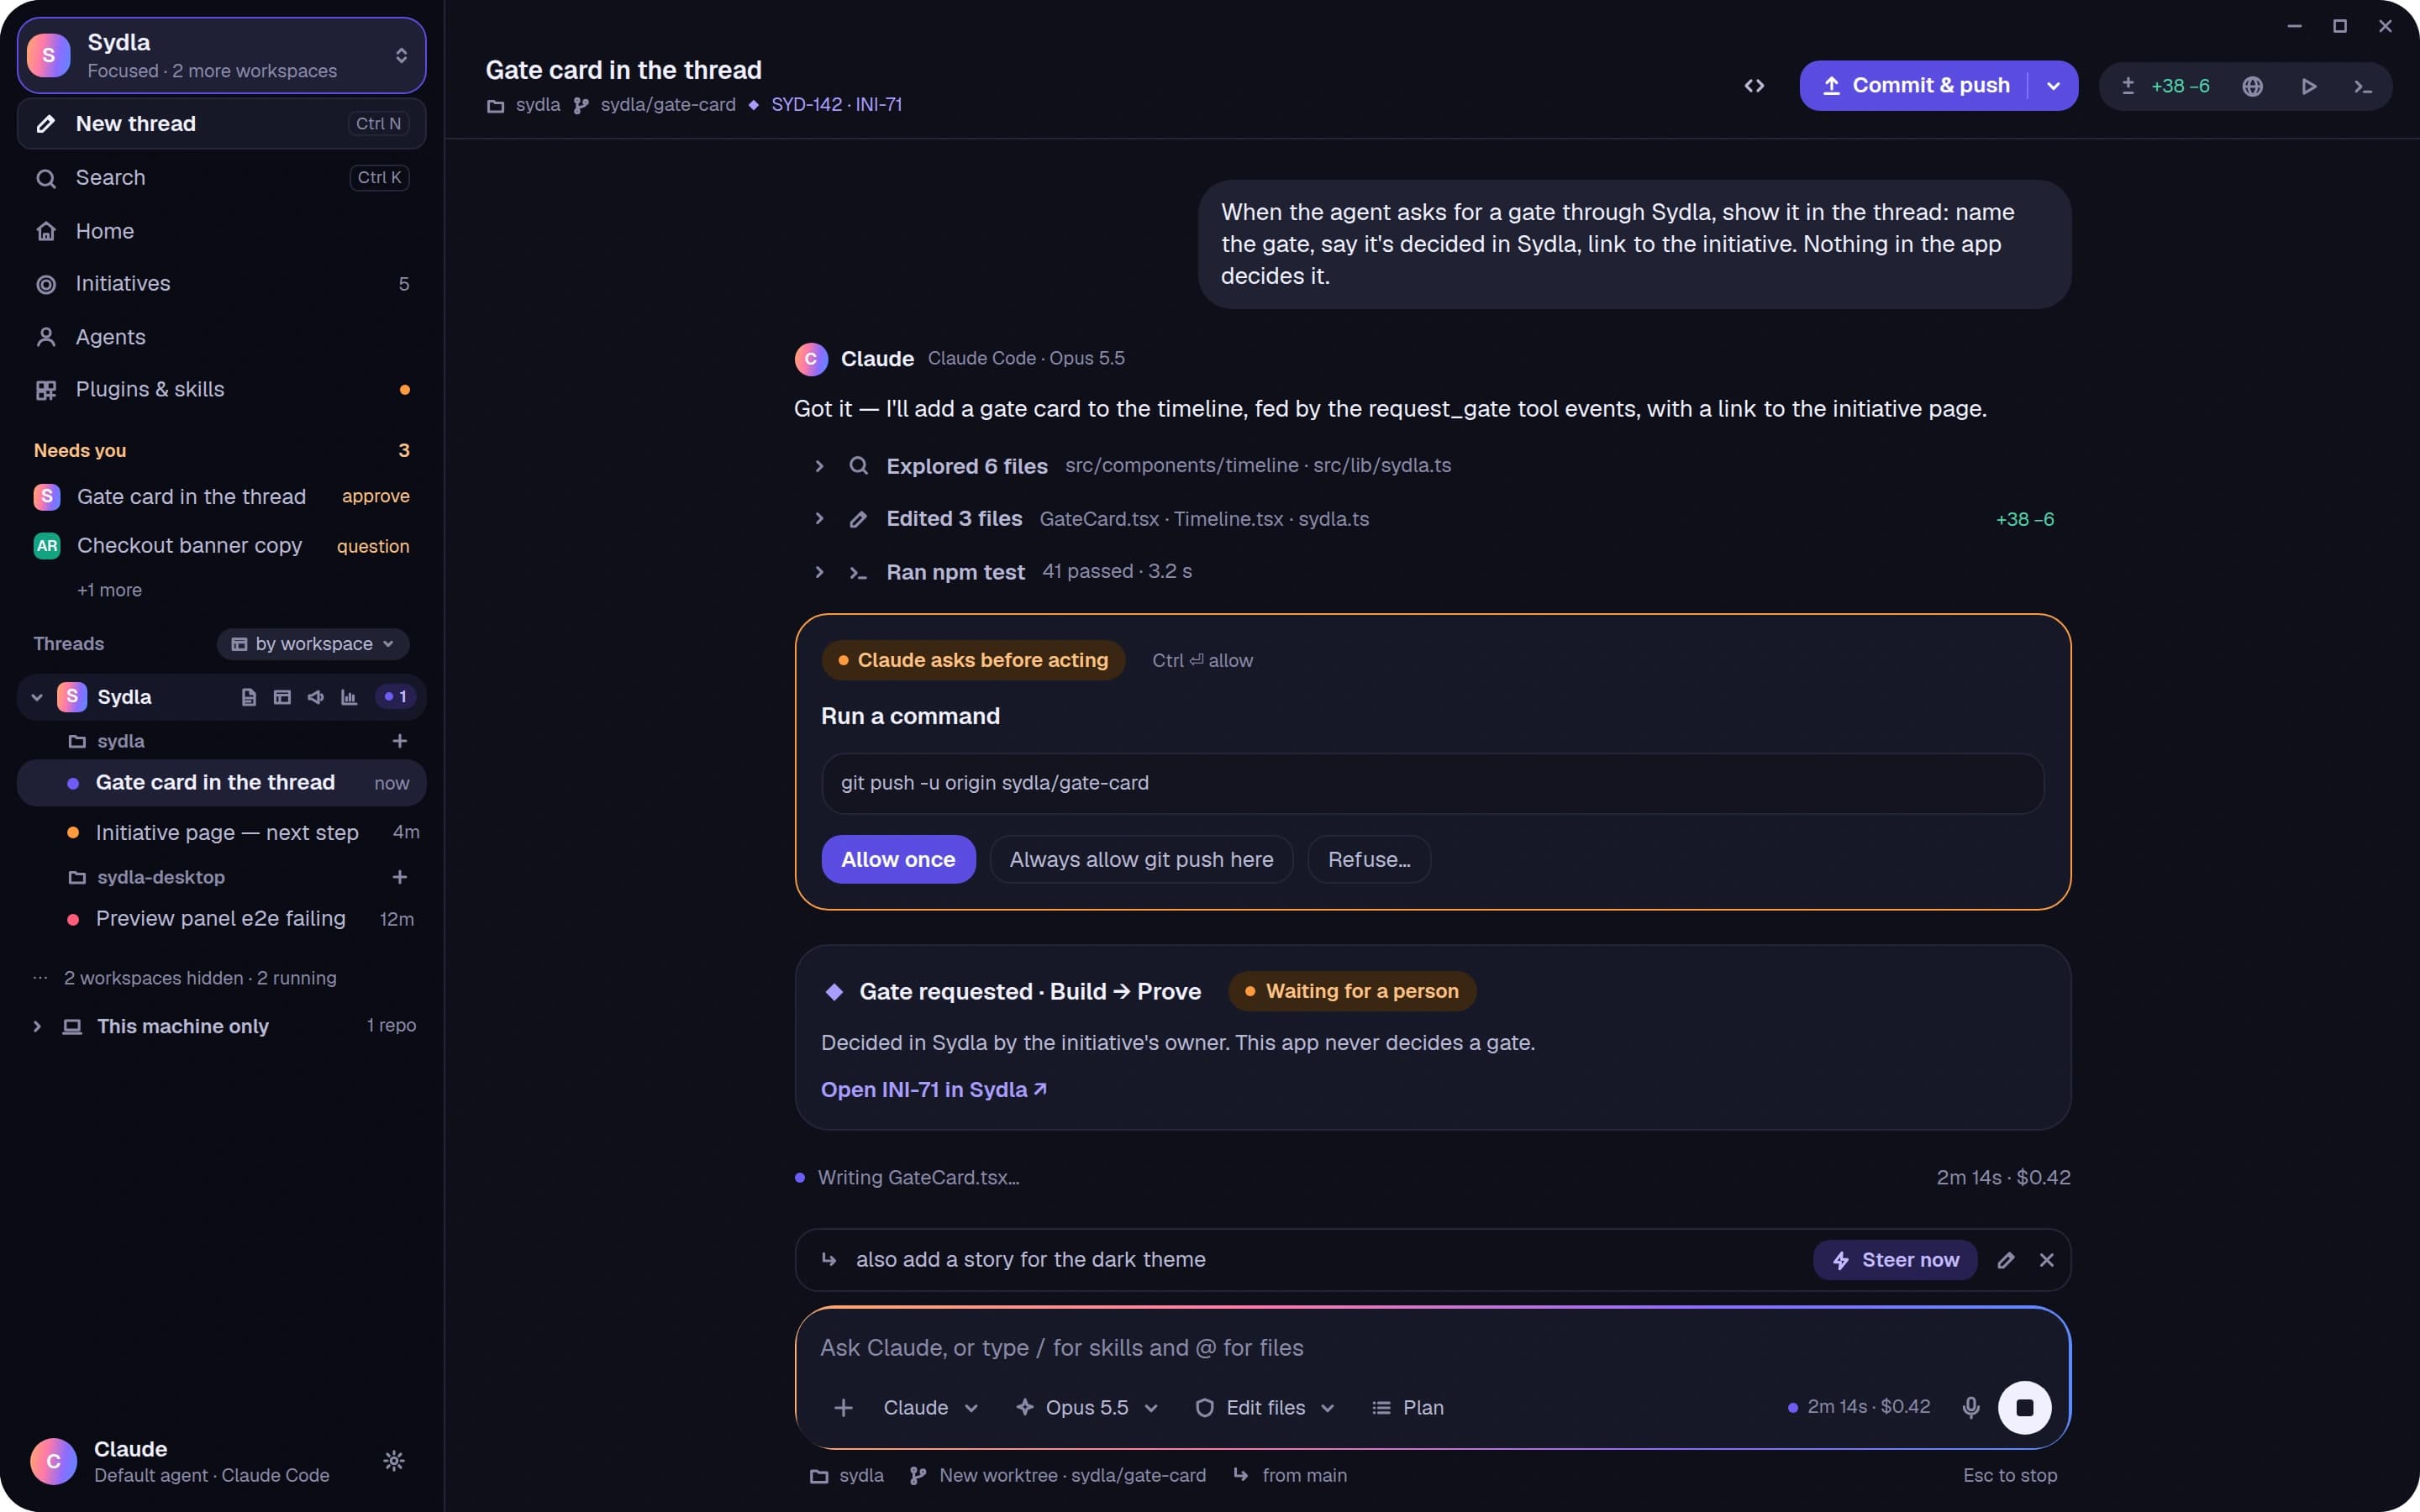
- Run in Sydla Desktop with your own agent. Sydla Desktop launches the Claude Code or Codex CLI on your machine, signed in with your own Anthropic or OpenAI account. The agent reads the work item through the Sydla MCP server, runs the baseline, makes the change, runs the measurement again and attaches both results to the run. There are no Sydla AI credits and no token markup. The Desktop guide walks through the first run.
- Review and sign-off. The CI gates run, a fresh session reads the diff, and the owner of the budget approves on the work item before the merge.
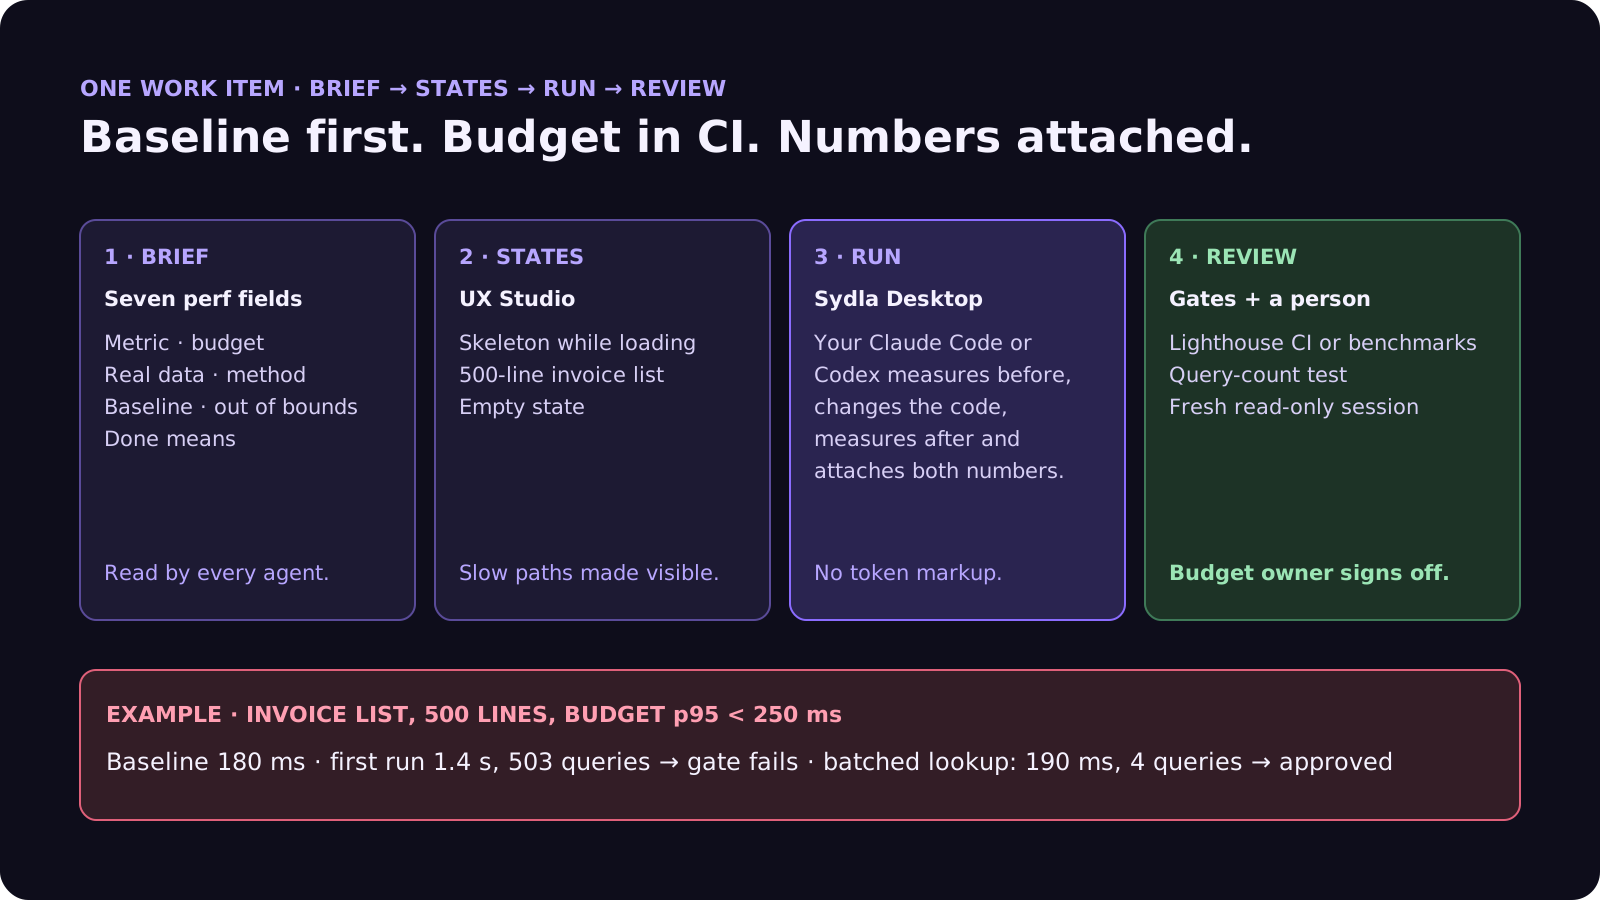
Agents write the change and the measurement. CI enforces the budget. People own the number.
A filled-in example: tax rates on the invoice list
Here is the opening ticket, rewritten as a performance brief. The service, sizes and timings are illustrative:
- Lane: Hot path. The invoice list is the most-used page in the billing app.
- What is measured: p95 response time of the invoice list endpoint, and queries per request.
- Budget: p95 under 250 ms and at most 5 queries per request, with 500 invoice lines.
- Realistic data: a seeded fixture with 500 lines across 12 tax regions, matching the largest customer.
- How to measure: the endpoint benchmark job in CI, 5 runs, median, on the standard runner, plus the query-count test.
- Baseline: 180 ms p95, 3 queries per request on main.
- Out of bounds: no cache on tax rates without an expiry tied to rate changes; don't edit the benchmark or the budget file.
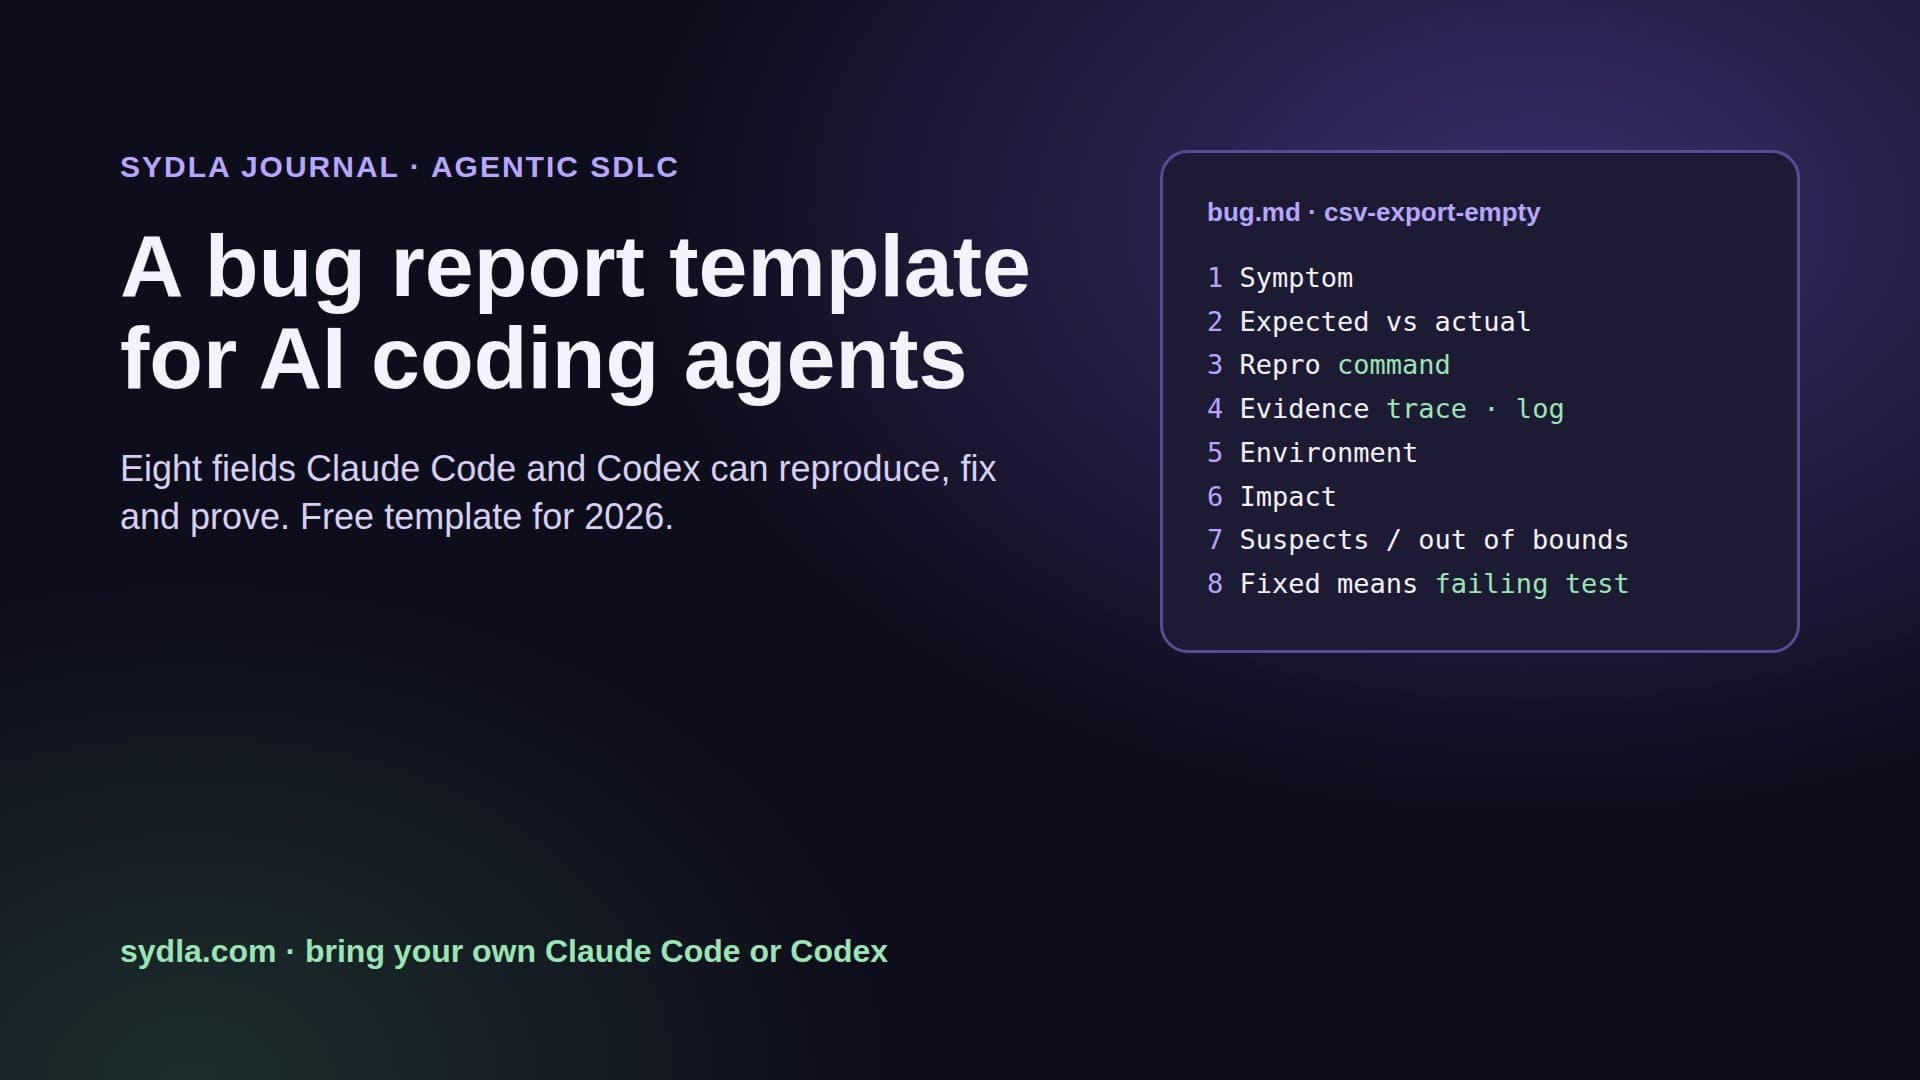
In this example the agent's first run does what the agent in the opening did: one tax lookup per line. The query-count test fails at 503 queries before anyone reviews it, and the benchmark shows 1.4 seconds. The agent switches to one batched lookup per region, the count drops to 4, and p95 lands at 190 ms. The fresh review session then spots a cache the agent added on the way, with no expiry, which field 6 forbids. One more fix, and the owner approves with both numbers on the work item. Our bug report template shows how to brief a slowdown that slips through anyway.
Frequently asked questions
Why do AI coding agents introduce performance regressions?
Because tests prove behaviour, not speed. Agents write correct code quickly, and an extra query inside a loop, a new client dependency or an extra re-render passes every unit test on small data. Without a budget in the ticket and a measurement in CI, nothing tells the agent or the reviewer that the change is slower.
What is a performance budget?
A number the code must stay within, with a unit, a percentile and a data size: for example, p95 latency under 250 ms for 500 invoice lines, or LCP within 2.5 seconds at the 75th percentile. It lives in a file owned by people, and CI fails the build when a change goes over it.
How do you catch performance regressions in CI?
Use Lighthouse CI assertions for web pages, run several times and take the median; benchmarks compared with main for hot code paths; and query-count tests on realistic data to catch N+1 queries. Then use real-user monitoring after release, because lab tests can't capture everything, such as INP on slow devices.
Can Claude Code or Codex optimize code for speed?
Yes, if they can measure. Give the agent the benchmark command, the baseline and the budget, and ask for before-and-after numbers from the same machine. OpenAI lists performance optimization among the ways its teams use Codex, and tools such as CodSpeed expose benchmark results to agents through an MCP server.
How much does Sydla cost compared with Jira, Confluence, Notion, Figma, Miro and Canva?
Sydla costs $19 per user per month. One paid seat each of Jira Standard, Confluence Standard, Notion Plus, Figma Professional Full, Miro Starter and Canva Business costs $83.85 per user per month, so the saving is $64.85 per user per month. You bring your own Claude Code or Codex account, so your Anthropic or OpenAI plan pays for the model with no markup.